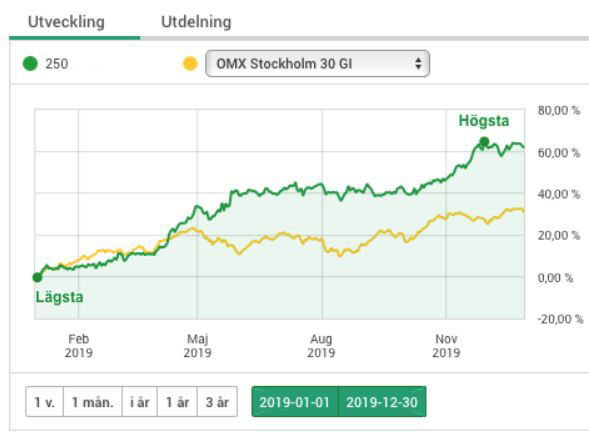
61.8% for 2019!
Below is the progress of our model portfolio during the last twelve years.
| YEAR | PORTFOLIO | INDEX (Incl. dividends) | Relative return |
| 2011 | -10.3 | -11.6 | +1.3 |
| 2012 | +21.2 | +17.5 | +3.7 |
| 2013 | +34.2 | +25.4 | +8.8 |
| 2014 | +21.8 | +13.9 | +7.9 |
| 2015 | +38.5 | +2.2 | +36.3 |
| 2016 | +22.6 | +9.4 | +13.2 |
| 2017 | +9.7 | +7.7 | +2.0 |
| 2018 | +2.7 | -7.0 | +9.7 |
| 2019 | +61.8 | +30.7 | +31.1 |
| 2020 | +26.8 | +7.4 | +19.4 |
| 2021 | +24.6 | +29.7 | -5.1 |
| 2022 | -10.6 | -15.5 | +4.9 |
| 2023 | +24.9 | +19.0 | +5.9 |
GENERAL STRATEGY IN THE MODEL PORTFOLIO
- Almost always 100% invested.
- Holds around 10 different shares, funds or ETFs (Exchanged Traded Funds)
- Sell call options 10-12 times a year in order to reduce the risk (Covered calls). Both against Index and specified stocks.
- Never short selling of futures, but a few times short selling stocks but always with a stop loss.
Here is a snapshot of the portfolio development for the full year of 2019: